Windows servers run hundreds of background services and processes that support authentication, networking, applications, and system operations. While most operate silently, a single failed service or runaway process can quickly trigger application slowdowns, authentication issues, or unexpected downtime.
Because of this, monitoring Windows services and processes now goes beyond simply checking whether they are running. Modern monitoring platforms provide continuous visibility into process behavior, detect anomalies early, and automate remediation when failures occur.
Best Practices for Monitoring Windows Services & Processes
In this article, we explore best practices for monitoring Windows services and processes in 2026.
1] Define what needs to be monitored
Every effective monitoring program starts with an inventory. Not every service or process carries the same risk, so before configuring a single alert, map out what is actually business-critical.
Start by identifying your non-negotiables:
- Mission-critical services like Active Directory, DNS, IIS, SQL Server, and Exchange.
- Leverage the Top Process Chart to pinpoint processes that demand immediate monitoring priority.
- Third-party applications with SLAs attached to them.
- Security-related processes such as antivirus engines, firewall services, and audit agents.
- Custom business applications and scheduled tasks that the business depends on daily.
This inventory serves as the backbone of your alert policies, escalation paths, and capacity planning.

2] Go beyond status checks
A service showing as “running” doesn’t necessarily mean it’s healthy. Services can remain technically active while silently degrading system performance or failing to process workloads efficiently. Process-level monitoring should cover:
- CPU usage per process, with alerts when it remains high.
- Private and virtual memory usage over time.
- Handle and thread counts, which can reveal resource leaks early.
- Disk I/O at the process level.
- Network connections tied to specific processes.
Tracking these metrics over weeks or months helps teams move from reactive troubleshooting to proactive issue detection. Degradation is rarely sudden because early warning signals, such as gradual memory growth or increasing thread counts, often appear well before a visible failure.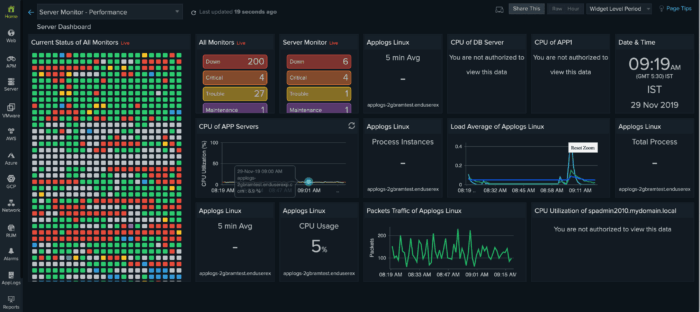
3] Move to real-time alerting
Traditional polling-based monitoring, checking status every five or 10 minutes, creates intervals that are simply too wide for modern environments. Teams should receive alerts whenever a service stops, a threshold is breached, or a critical event appears in the Windows Event Log.
A few principles that make alerting actually useful:

- Set thresholds at the process level, not just the server level.
- Use Windows Event Log forwarding to centralize alerts across servers, filtering by Event IDs such as 7034 (service crash) and 7031 (unexpected stop).
- Organize alerts by informational, warning, and critical levels to prevent on-call engineers from being overwhelmed by unnecessary notifications.
- Route alerts to the right people via the right channels (email, SMS, Teams, Zoho Cliq, Slack, PagerDuty).
4] Automate recovery
When a service crashes unexpectedly, you don’t always want a human to be the first line of response. Automated recovery, such as restarting a failed service, running a remediation script, or escalating to a reboot as a last resort, can dramatically reduce your mean time to recovery.
For example, if an IIS application pool stops responding due to memory exhaustion, an automated restart can restore service within seconds, often before users notice an outage.
In addition, every automated recovery action should generate a notification, so your team stays informed, even when nothing appears to be broken.
5] Centralize your logs
The Windows Event Log provides valuable diagnostic information, but it is only effective if collected and analyzed systematically. Forward logs to a centralized SIEM or log management platform, define filters for relevant Event IDs, and correlate process events with security logs to detect anomalous behavior early. Retain at least 90 days of log data for forensic and compliance purposes.
This is also where a unified monitoring platform earns its keep. For instance, platforms like Site24x7 combine Windows Event Log collection, performance metrics, and uptime monitoring into a single dashboard, enabling teams to correlate service failures with infrastructure performance in real time.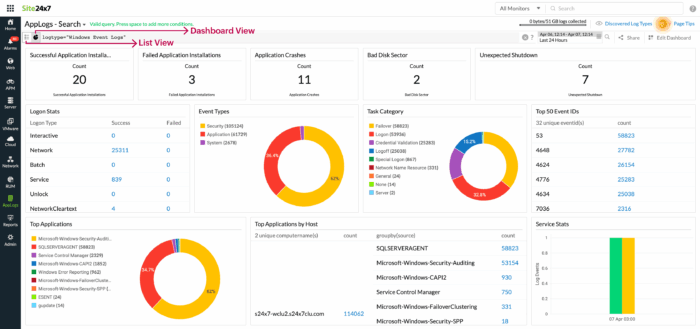
6] Build baselines, then use anomaly detection
Static thresholds are a starting point, not a finish line. AI-assisted anomaly detection is now a standard feature in leading monitoring platforms because it learns the normal behavior patterns of services and processes over time and alerts you when something deviates, even if it hasn’t crossed a hard limit.
Configure your monitoring solution to collect at least two to four weeks of performance data before relying on anomaly alerts. This enables it to distinguish genuine issues from predictable spikes, such as month-end processing or scheduled batch jobs.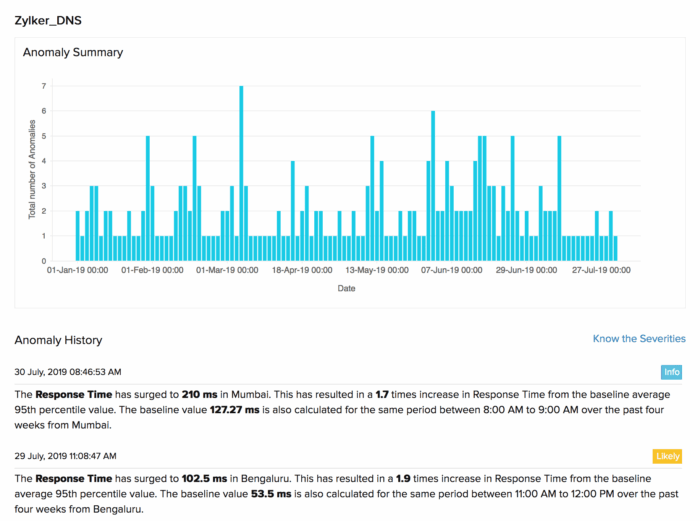
7] Secure the monitoring infrastructure itself
Monitoring agents and dashboards can become attack vectors if not properly secured. Apply the same security rigor to your monitoring infrastructure as you do to the rest of your environment:
- Enforce TLS 1.3 for all agent-to-server communications.
- Apply the principle of least privilege to monitoring service accounts.
- Require MFA and role-based access for dashboard logins.
- Keep agents and management platforms patched.
- Maintain a full audit trail of configuration changes.
Final thoughts
Effective Windows service and process monitoring in 2026 relies on three principles: understanding normal performance, detecting deviations, and implementing automation for rapid response.
Modern platforms that integrate Windows Services and Process monitoring and centralized log management make it easier to gain full visibility into service health and system behavior.
Solutions like Site24x7 bring these capabilities together in a single platform, empowering teams to monitor critical services, analyze logs, detect anomalies, and respond to incidents before they impact users.
Leave a Reply