Your Windows system generates hundreds of performance metrics every minute. However, numbers alone don’t tell you if something’s wrong. The real question is, what’s normal for your specific system?
That’s where baselines and thresholds become crucial!
Understanding Windows system baselines
A baseline is a snapshot of your system’s normal operating conditions over time. It defines what healthy means for your specific infrastructure and workloads, not for Windows environments in general.
For example, a file server might normally operate at 40% CPU during business hours, while a web server serving the same application might sit at 15% CPU. Applying identical thresholds to both systems would result in false alarms and overlook genuine issues.
Capturing these patterns over days or weeks during multiple business cycles helps establish what healthy operations looks like. Without this context, even accurate metrics can lead to misleading conclusions and unnecessary alerts.
Key Windows metrics to monitor
Choosing which metrics to monitor is just as important as setting appropriate thresholds for them.
- CPU utilization: This is the most commonly monitored metric, yet also the most frequently misinterpreted. Sustained CPU elevation above your baseline demands investigation, but brief spikes during backup operations or scheduled maintenance are expected and normal.
- Memory: This metric can be confusing because Windows utilizes available RAM as a disk cache for improved performance. A server at 92% memory with low page faults is functioning as designed, while the same usage with high paging signals real memory pressure.
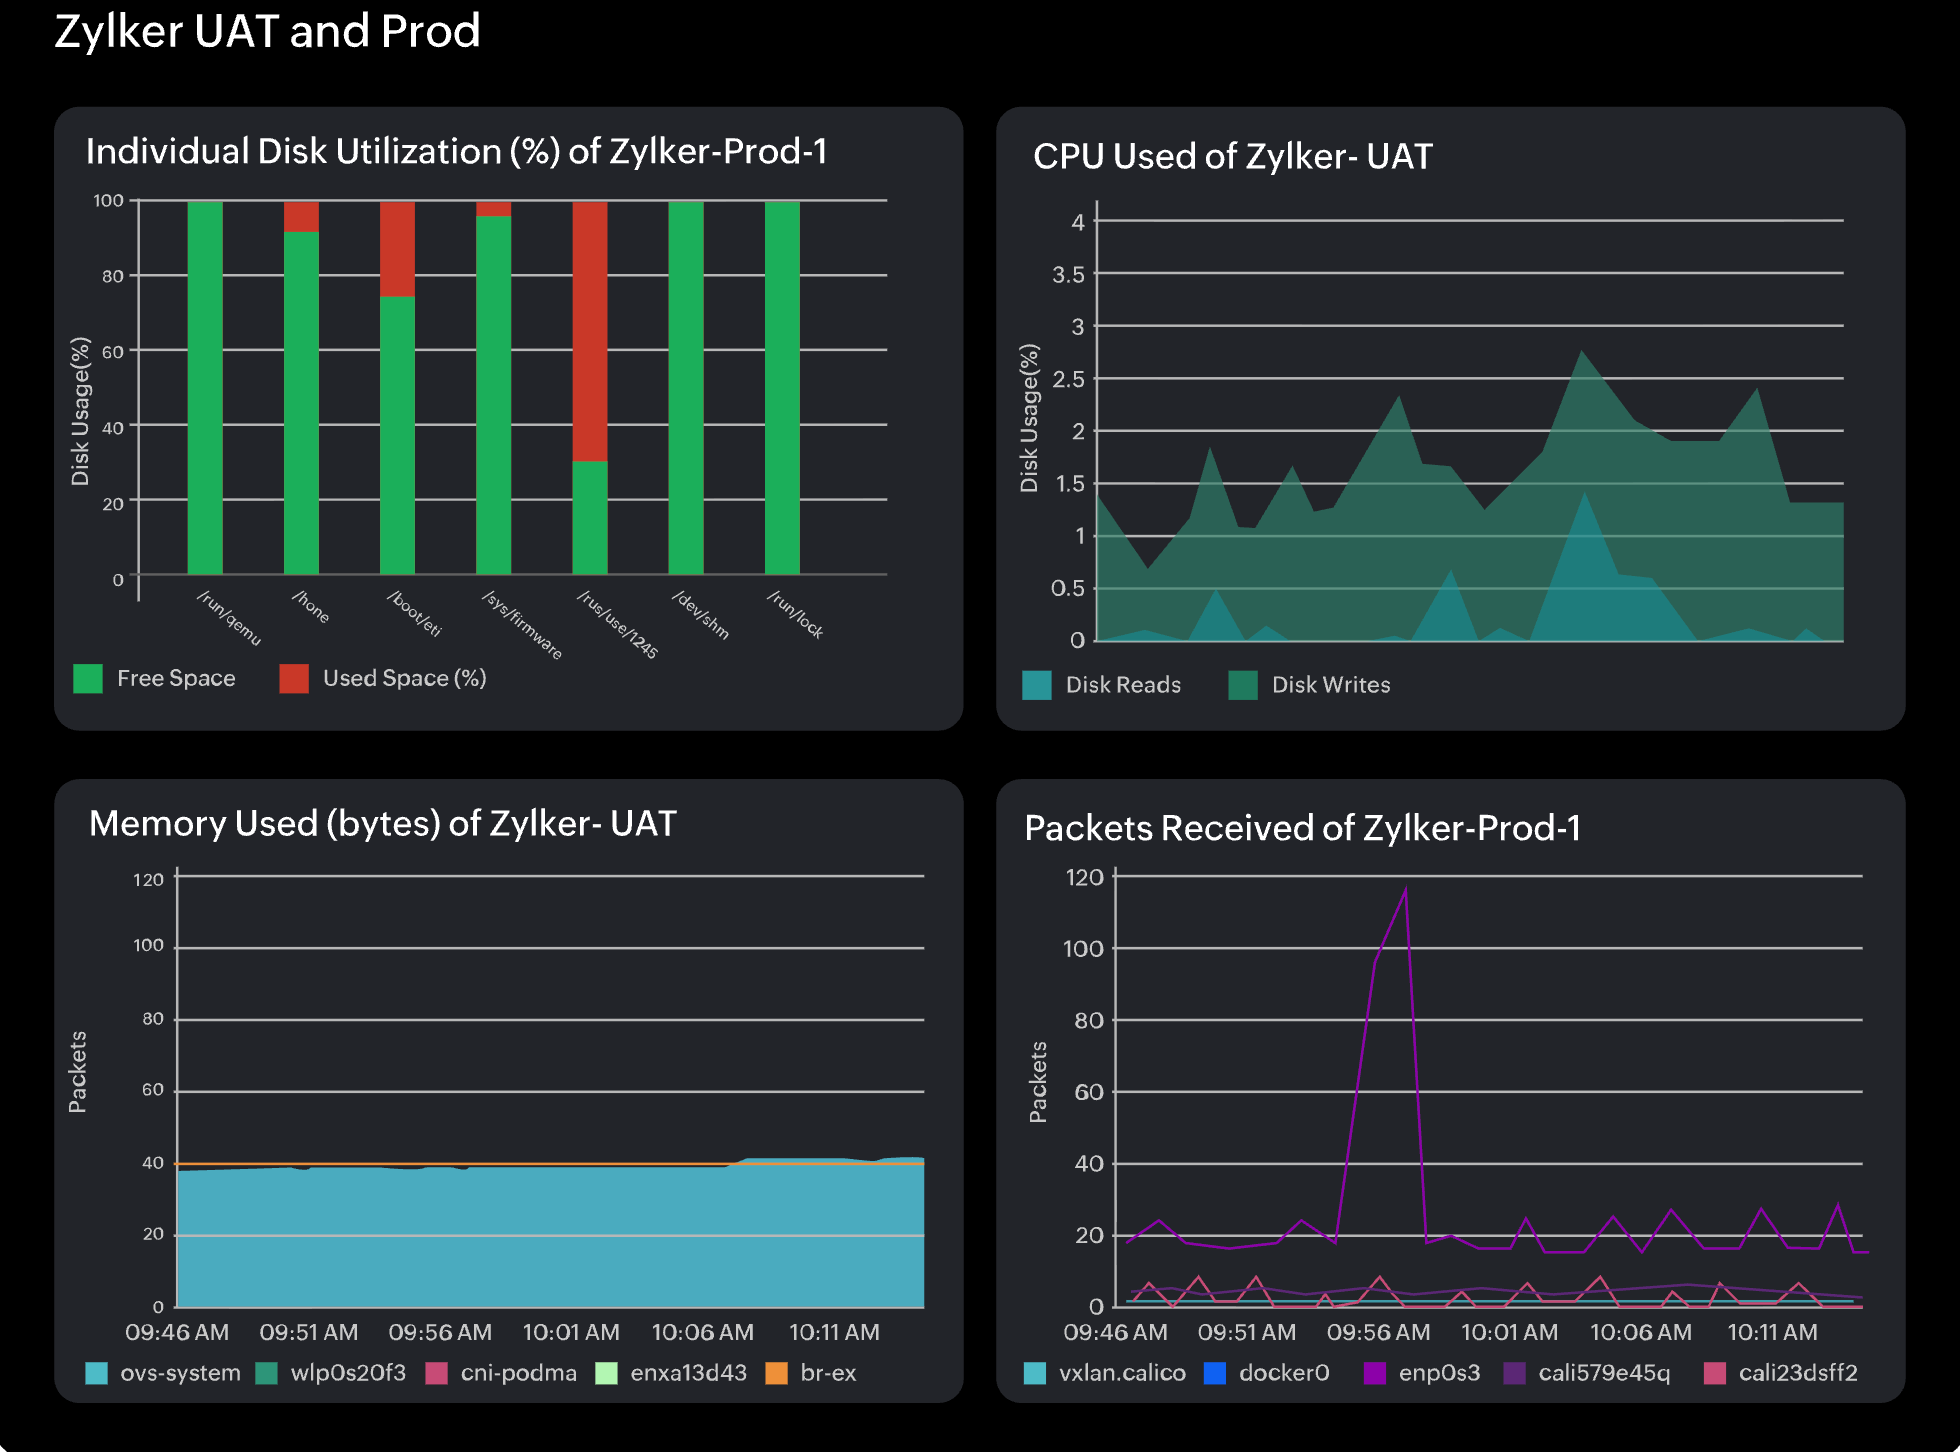
- Disk I/O patterns: These patterns indicate the intensity of your storage subsystem’s usage. High I/O with increased response times indicates a problem, but high I/O alone may indicate normal batch operations.
- Network traffic: Traffic should be measured against the expected throughput. A sustained spike might indicate malware, attacks, or unauthorized transfers.
- Disk space: Disk space usage is typically predictable if monitored regularly. A drive that gradually fills to 85% over six months is manageable, while reaching 85% overnight suggests unusual activity.
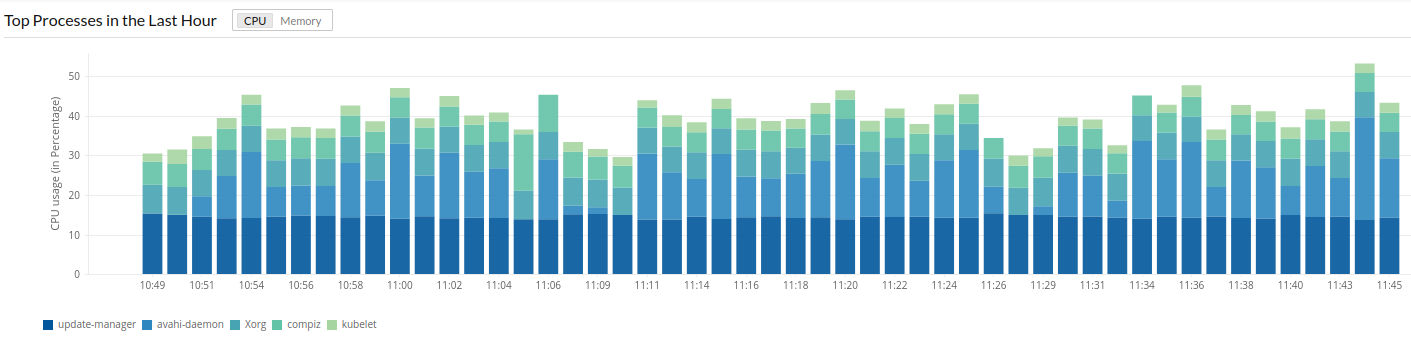
- Windows services performance: Tracking performance of your Windows services provides critical application-level visibility. Monitoring the most resource-intensive services, such as the top CPU-consuming services or services with degraded response times, helps identify which processes are driving load on the server.
Static thresholds vs. dynamic thresholds
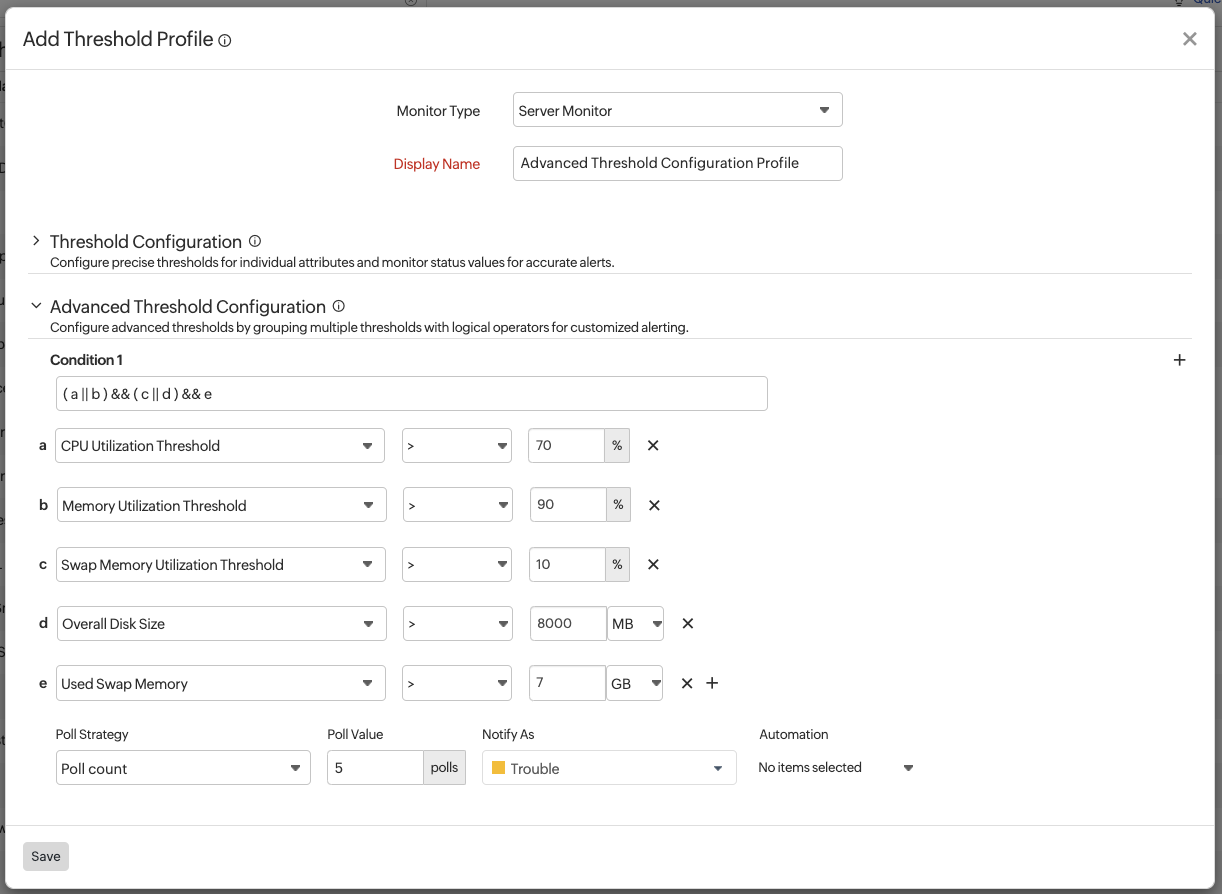
Static thresholds are fixed values for acceptable behavior of the system. For instance, a server with a CPU utilization above 90% is generally problematic, regardless of the timing or server type.
However, static thresholds ignore context like time of day, day of week, seasonal variations, and legitimate operational spikes. As a result, they often produce:
- Excessive false positives during expected peaks.
- Missed early warnings during slow performance degradation.
Dynamic thresholds use machine learning to adjust based on normal behavior patterns automatically. Intelligent monitoring systems learn normal patterns for each metric and trigger alerts only when behavior deviates from these patterns.
For example, the system learns that high CPU usage during nightly backups is normal, but flags the same behavior during idle hours as anomalous.

How it works: AI analyzes historical data to identify patterns at seasonal levels and creates confidence bands (e.g., upper and lower bounds) for what is considered normal at each time. Anomalies trigger alerts; expected variations don’t.
Dynamic thresholds are especially effective for:
- Virtualized and cloud environments where workloads change constantly.
- Systems with unpredictable patterns where fixed limits don’t reflect normal behavior.
- Large-scale deployments where manual tuning is impractical.
By focusing on deviations rather than fixed thresholds, dynamic thresholds reduce noise and highlight meaningful issues more quickly.

When to worry: Threshold guidelines
Determining when to be concerned about changes in behavior depends on addressing four key questions:
- Is this abnormal for the specific system? Current metrics should be compared to the established baseline, rather than to industry standards or other systems. A reading that is normal for the environment does not indicate a problem.
- Is the condition sustained or momentary? A brief spike to 95% CPU is often harmless, while sustained elevation at 75% for an hour warrants investigation. Alert duration should be configured appropriately, requiring thresholds to be breached for at least five to ten minutes before an alert is triggered.
- What is the direction of change? Gradual increases over several weeks may indicate the need for capacity planning, whereas sudden spikes suggest immediate issues. Trend-based alerts should be configured to detect slow degradation before it becomes critical.
- Does the anomaly correlate with other metrics? High CPU usage alone may be normal, but concurrent high CPU, disk I/O, and memory usage suggest a genuine issue. Correlated alerting should be employed to reduce unnecessary notifications.
Establishing baselines with native Windows tools
Professional monitoring solutions exist, but you can establish initial baselines using Windows’ built-in capabilities.
Performance Monitor (PerfMon) is Windows’ native performance tracking tool. Create data collector sets to capture your key metrics over time, establishing baseline behavior patterns.
Task Manager and Resource Monitor provide quick snapshots, though the data from these tools is not suitable for long-term trend analysis.
Windows Event Viewer captures system and application events that contextualize performance changes.
As environments grow and workloads become more dynamic, manually maintaining baselines and thresholds becomes increasingly difficult. This is where automation becomes essential.
Site24x7‘s Zia AI engine automates dynamic thresholds using machine learning, analyzing historical data to understand seasonality and workload patterns automatically.
For Windows administrators, Site24x7’s Windows-specific monitoring offers intelligent threshold management, achieving over 60% fewer false positives without manual tuning.
Conclusion
Understanding baselines and thresholds is foundational to good system monitoring. However, server monitoring becomes essential when you have hundreds of servers and thousands of metrics to manage.
Your Windows infrastructure continuously communicates its health through performance metrics. With the right baseline understanding and an intelligent monitoring platform, you can monitor your Windows system and respond to issues effectively.
Leave a Reply